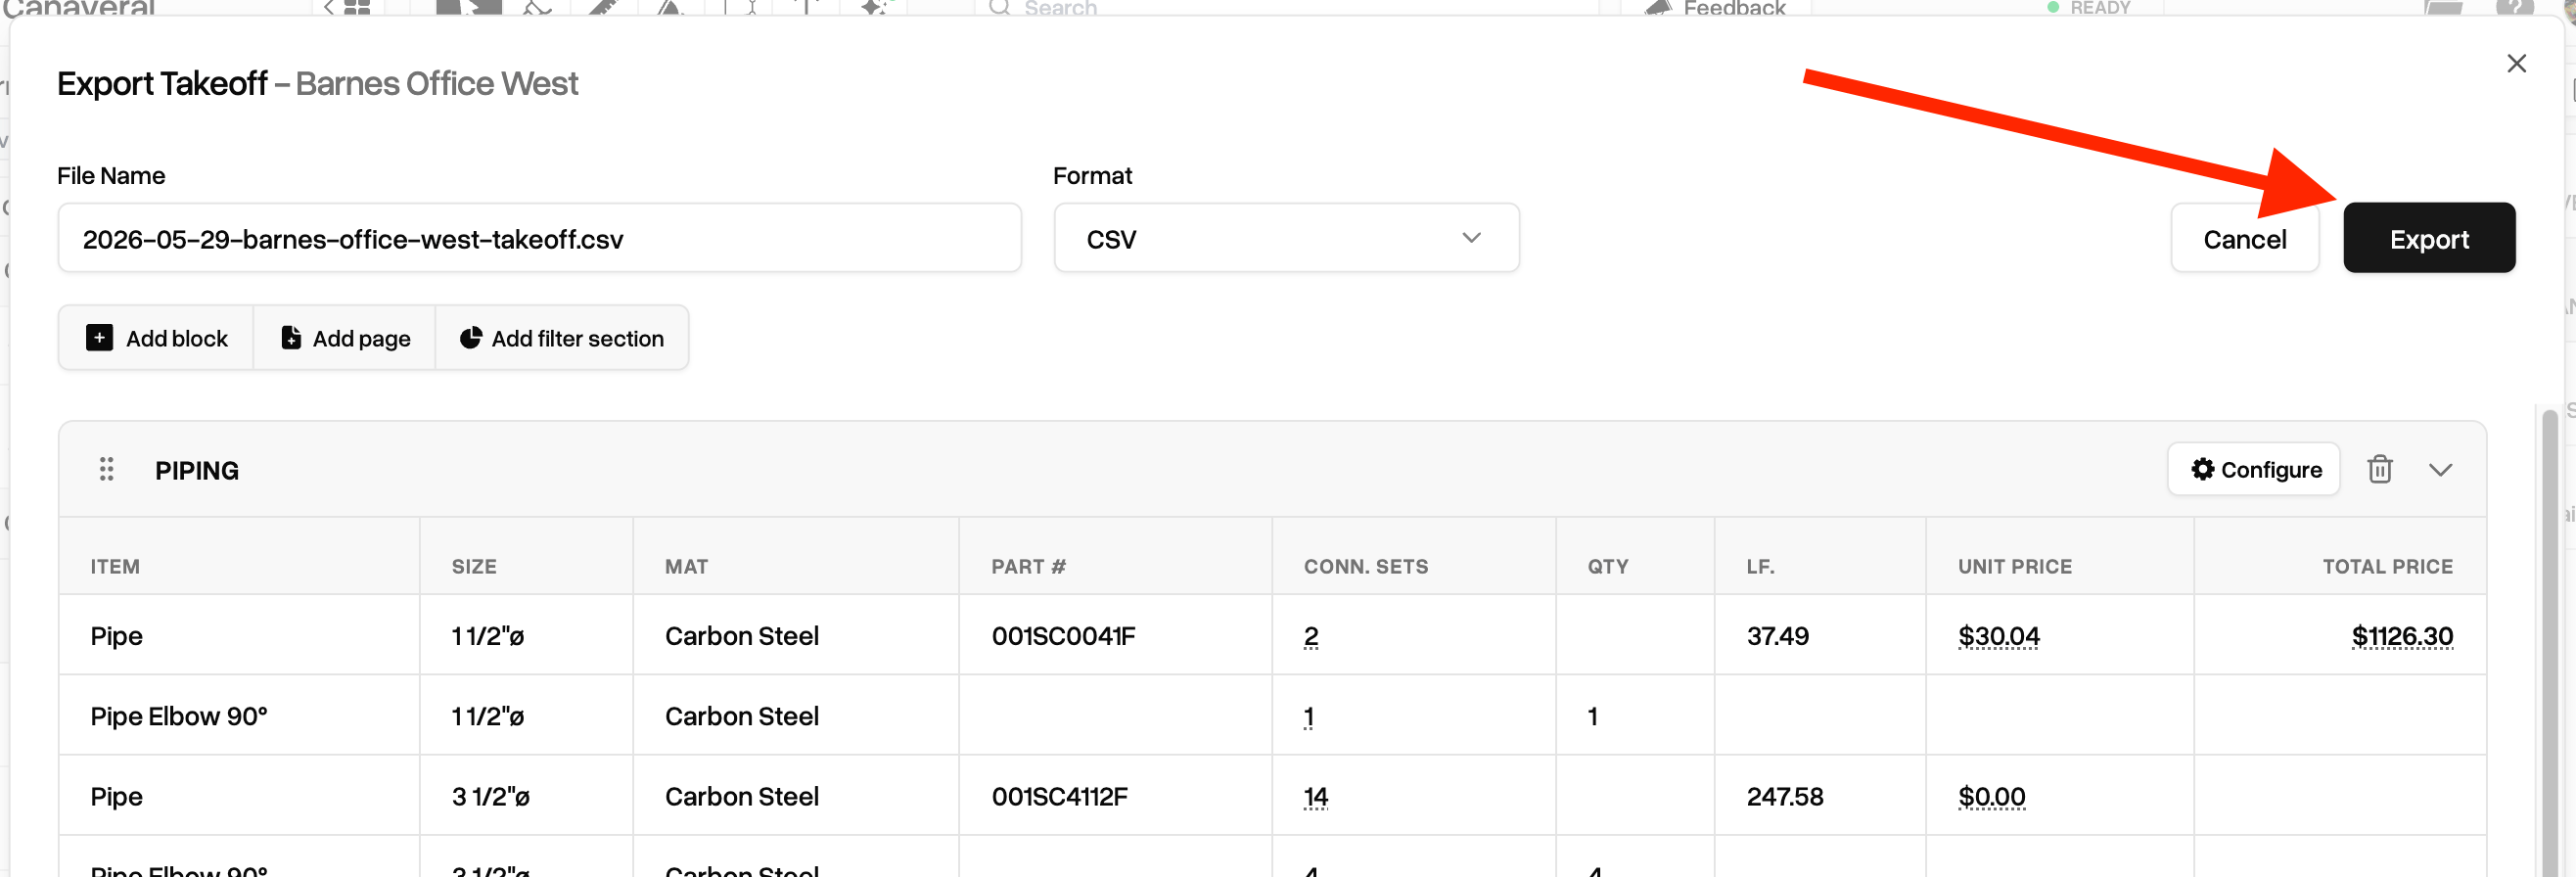
Trigger the Export takeoff modal
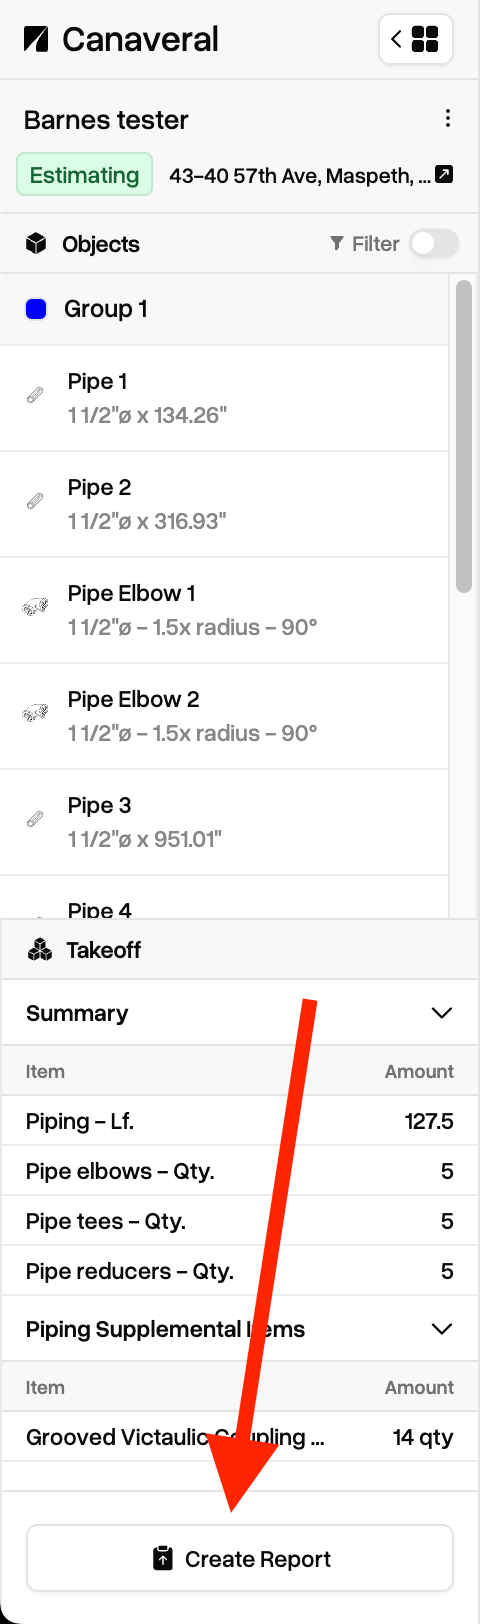
You can generate a report for a project in two places in Canaveral. The first is on the left sidebar of the Takeoff view. There is a 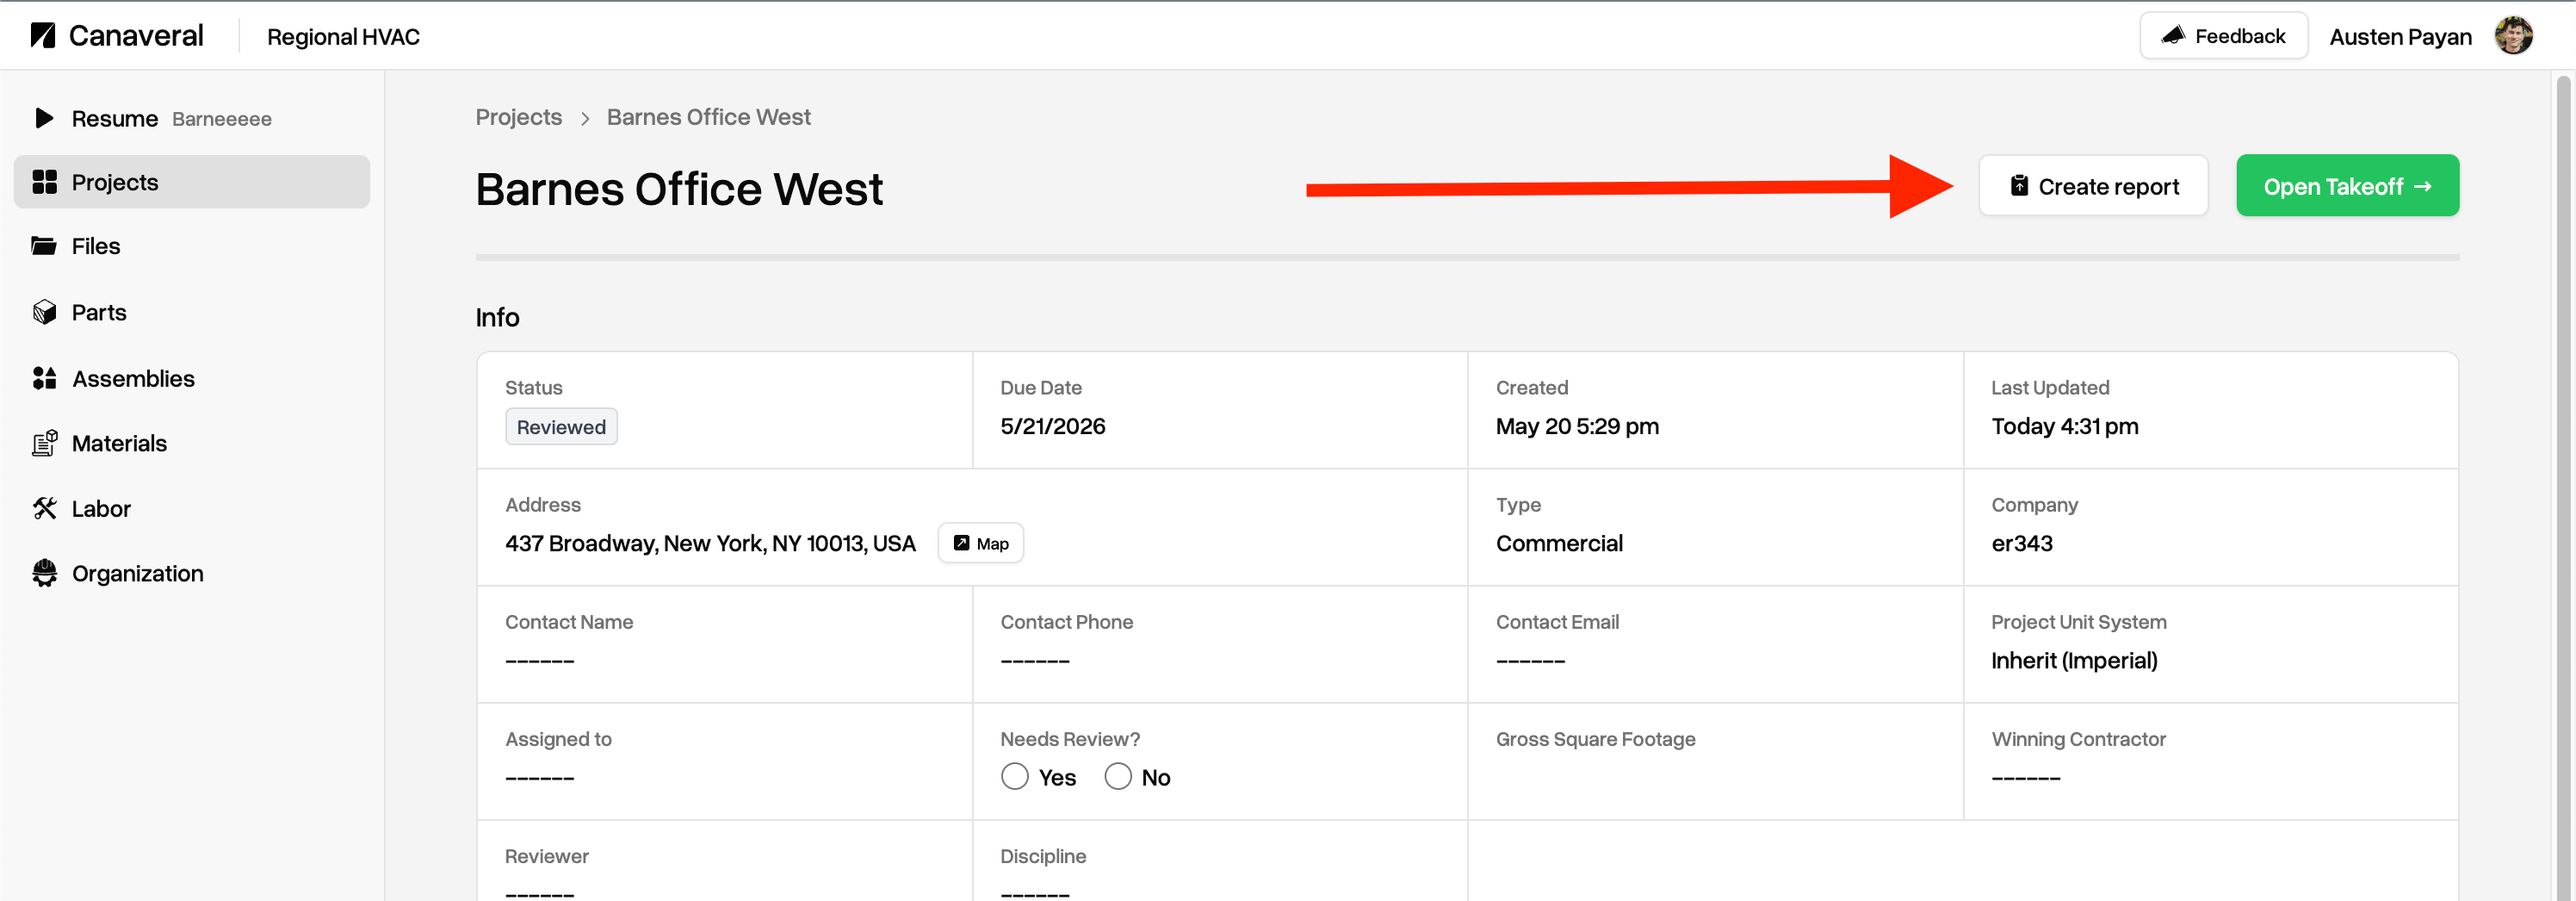
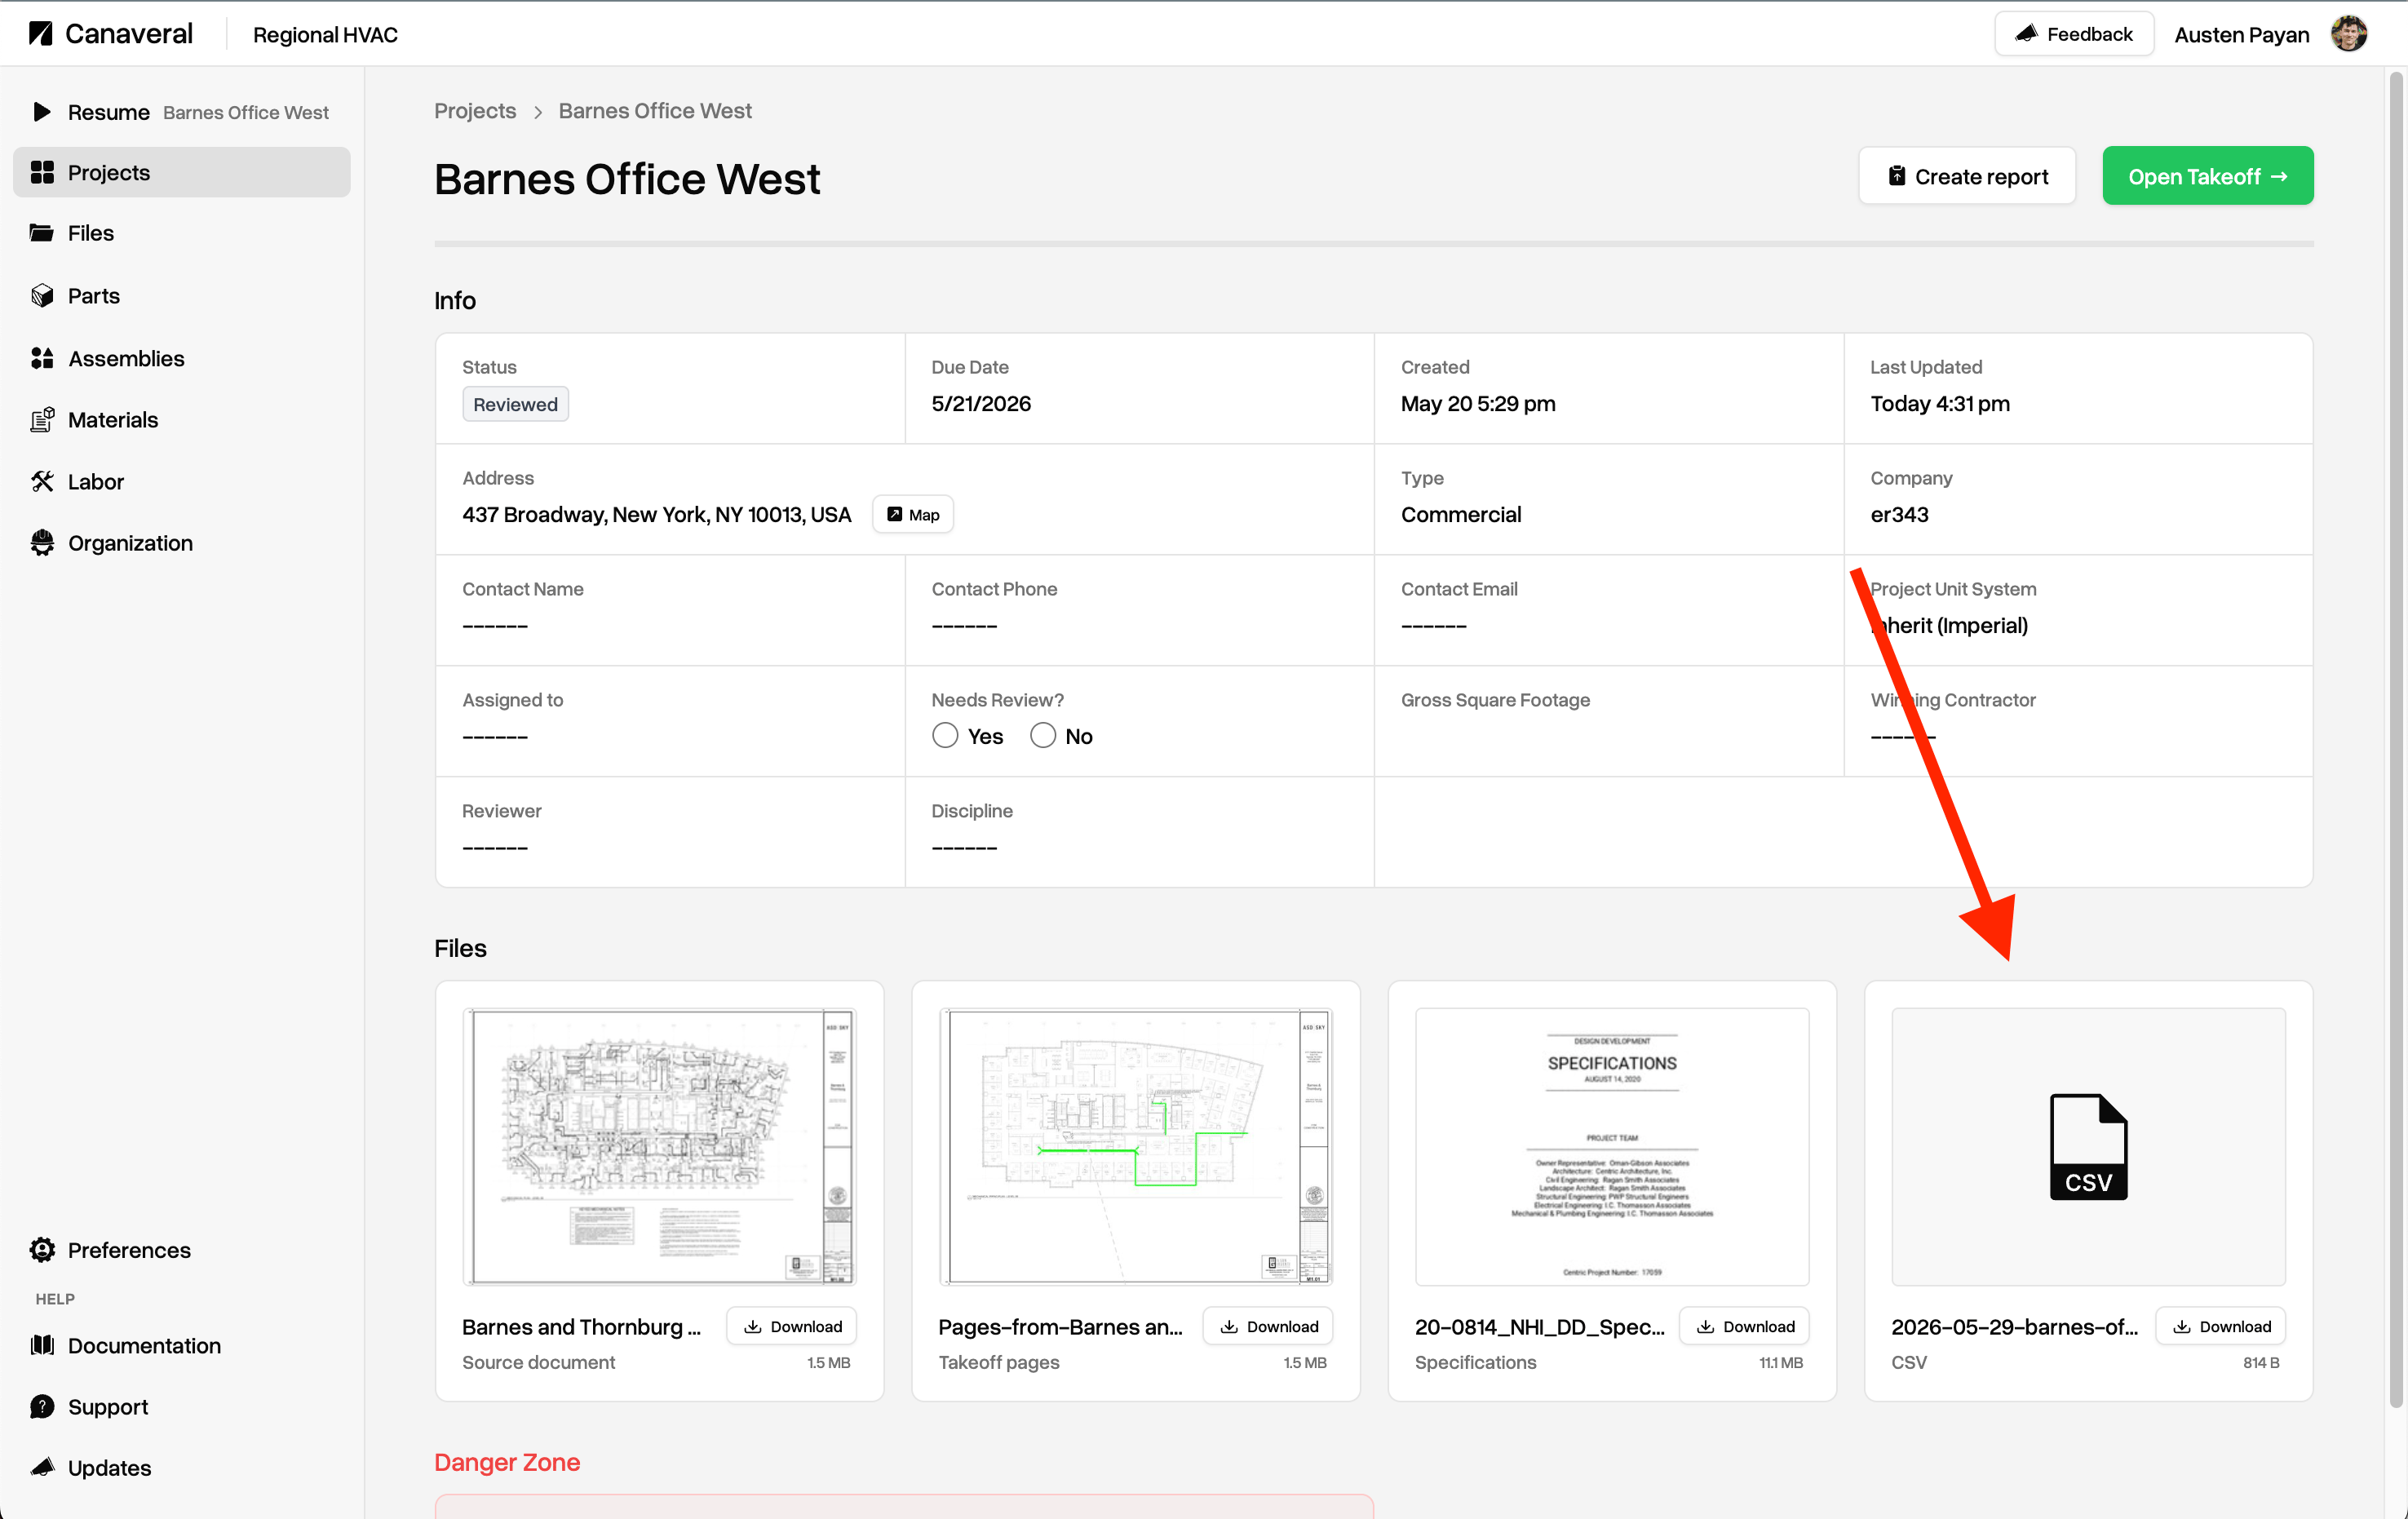
Create Report button in the bottom of the sidebar underneath the Takeoff summary section.The second place is the Create Report button in the project’s overview page in your Dashboard. You’ll find this directly to the left of the green Open Takeoff button.Configure report content
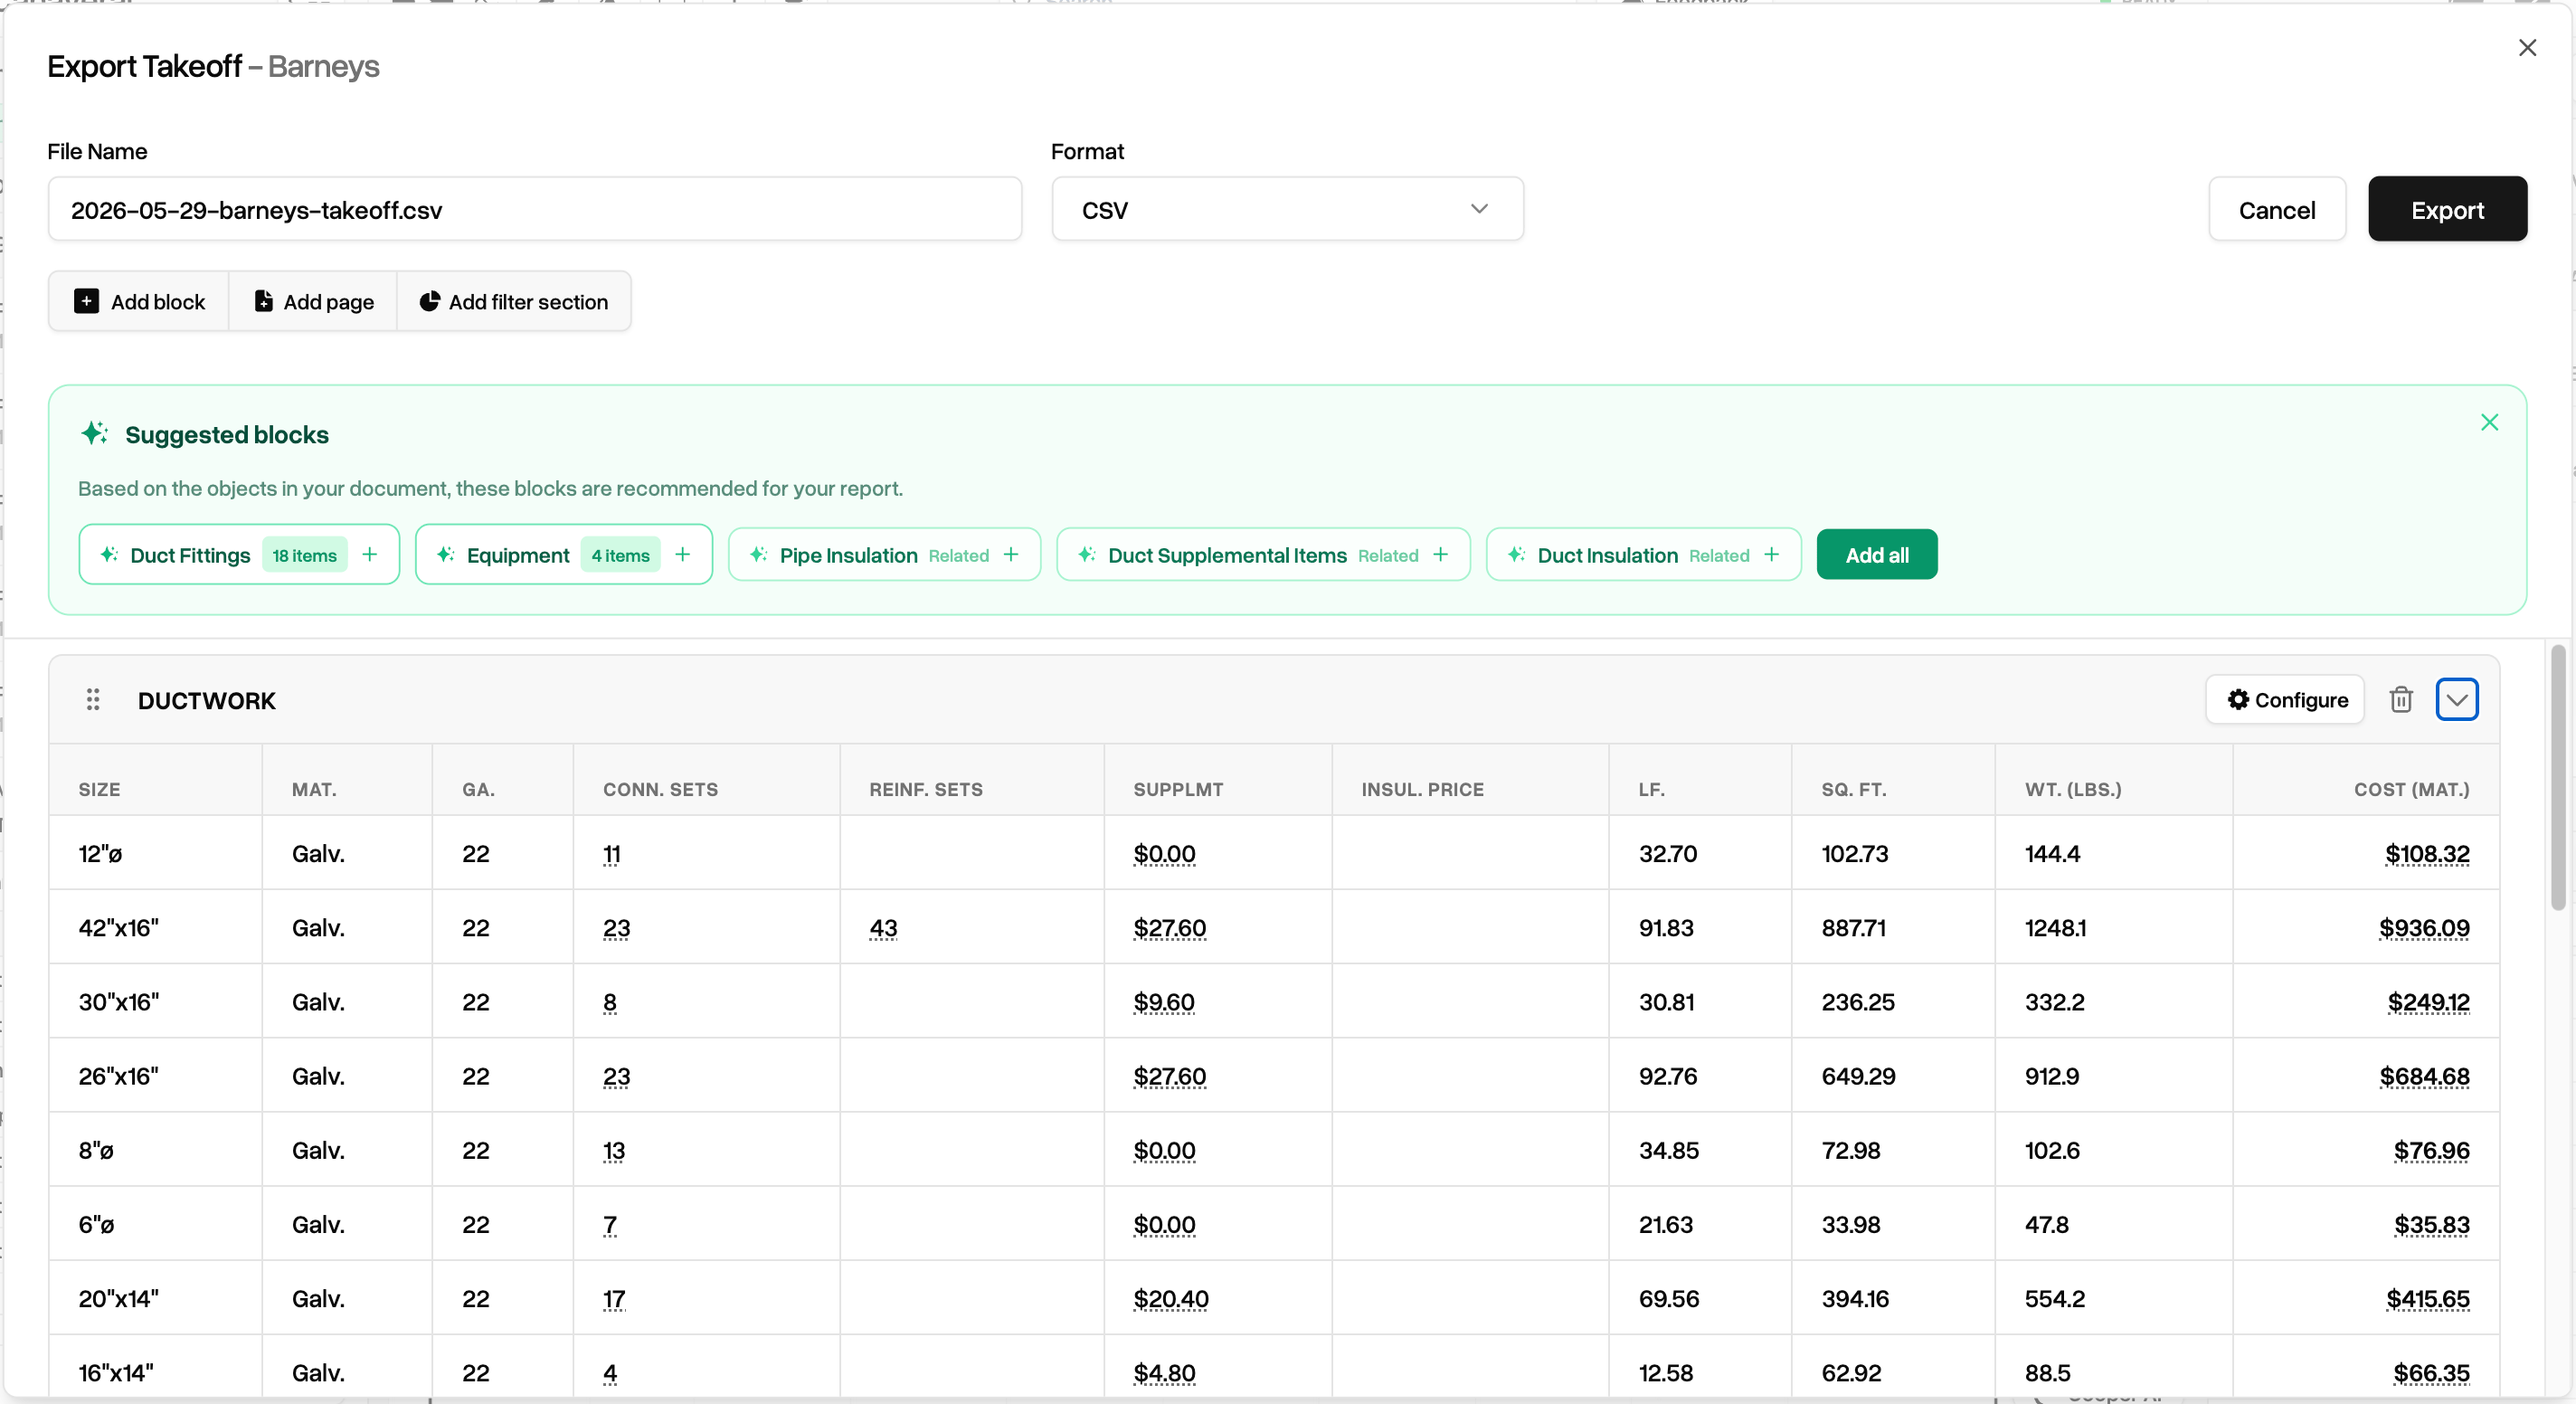
File name and format

YYYY-MM-DD string appended with the project name and takeoff at the end, but you can edit to your liking.
Supported formats are CSV, Excel, and PDFs.
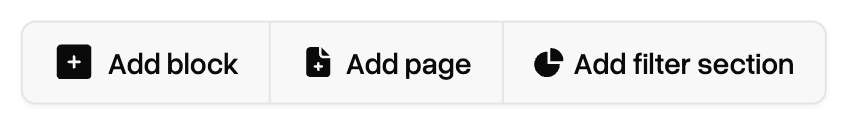
Add block , Add page, and Add filter section.
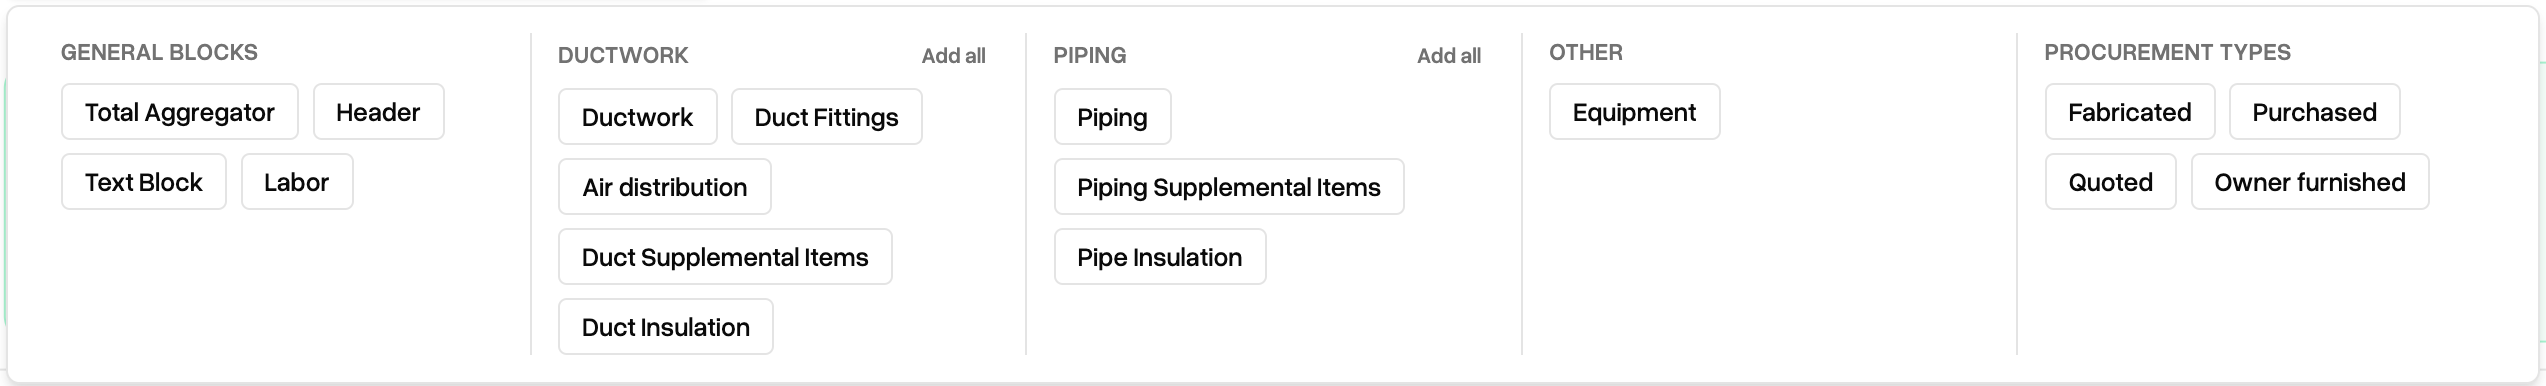
Blocks
ClickingAdd block opens up our available blocks panel. Choose from ductwork or piping related tables, headers or raw text blocks, or a number of other blocks useful for specific facets of Mechanical estimating.
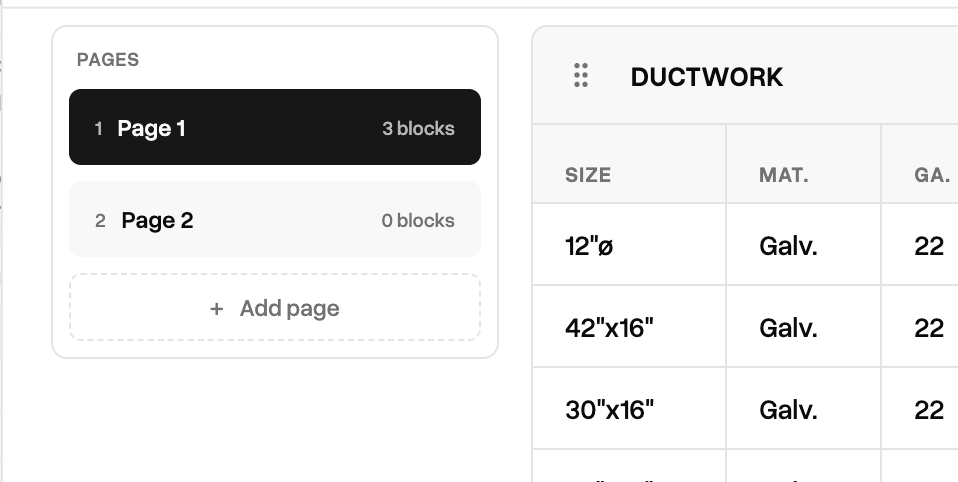
Pages
ClickingAdd page adds a new page when creating a PDF report, or a new tab in a CSV or Excel sheet.
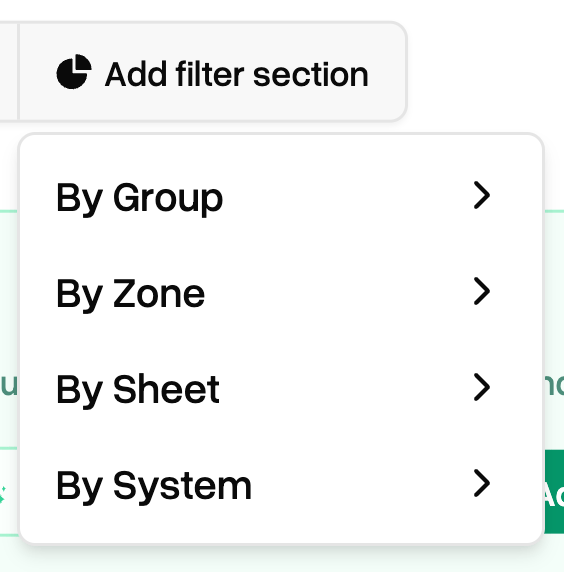
Filter sections
Filter sections let you slice takeoff data by group, zone, sheet, or system. Adding blocks to a filter section (or dragging existing blocks into them) will automatically scope the data within by that specific filter. This is useful if you want to segment your report by certain plan sheets, or only supply duct, or a specific Canaveral group you have created in your takeoff objects.

Data tables
Data tables in Canaveral are blocks that display takeoff data. There are numerous data table blocks described above. They typically look like this, with identifier columns on the left and metadata and price columns on the right.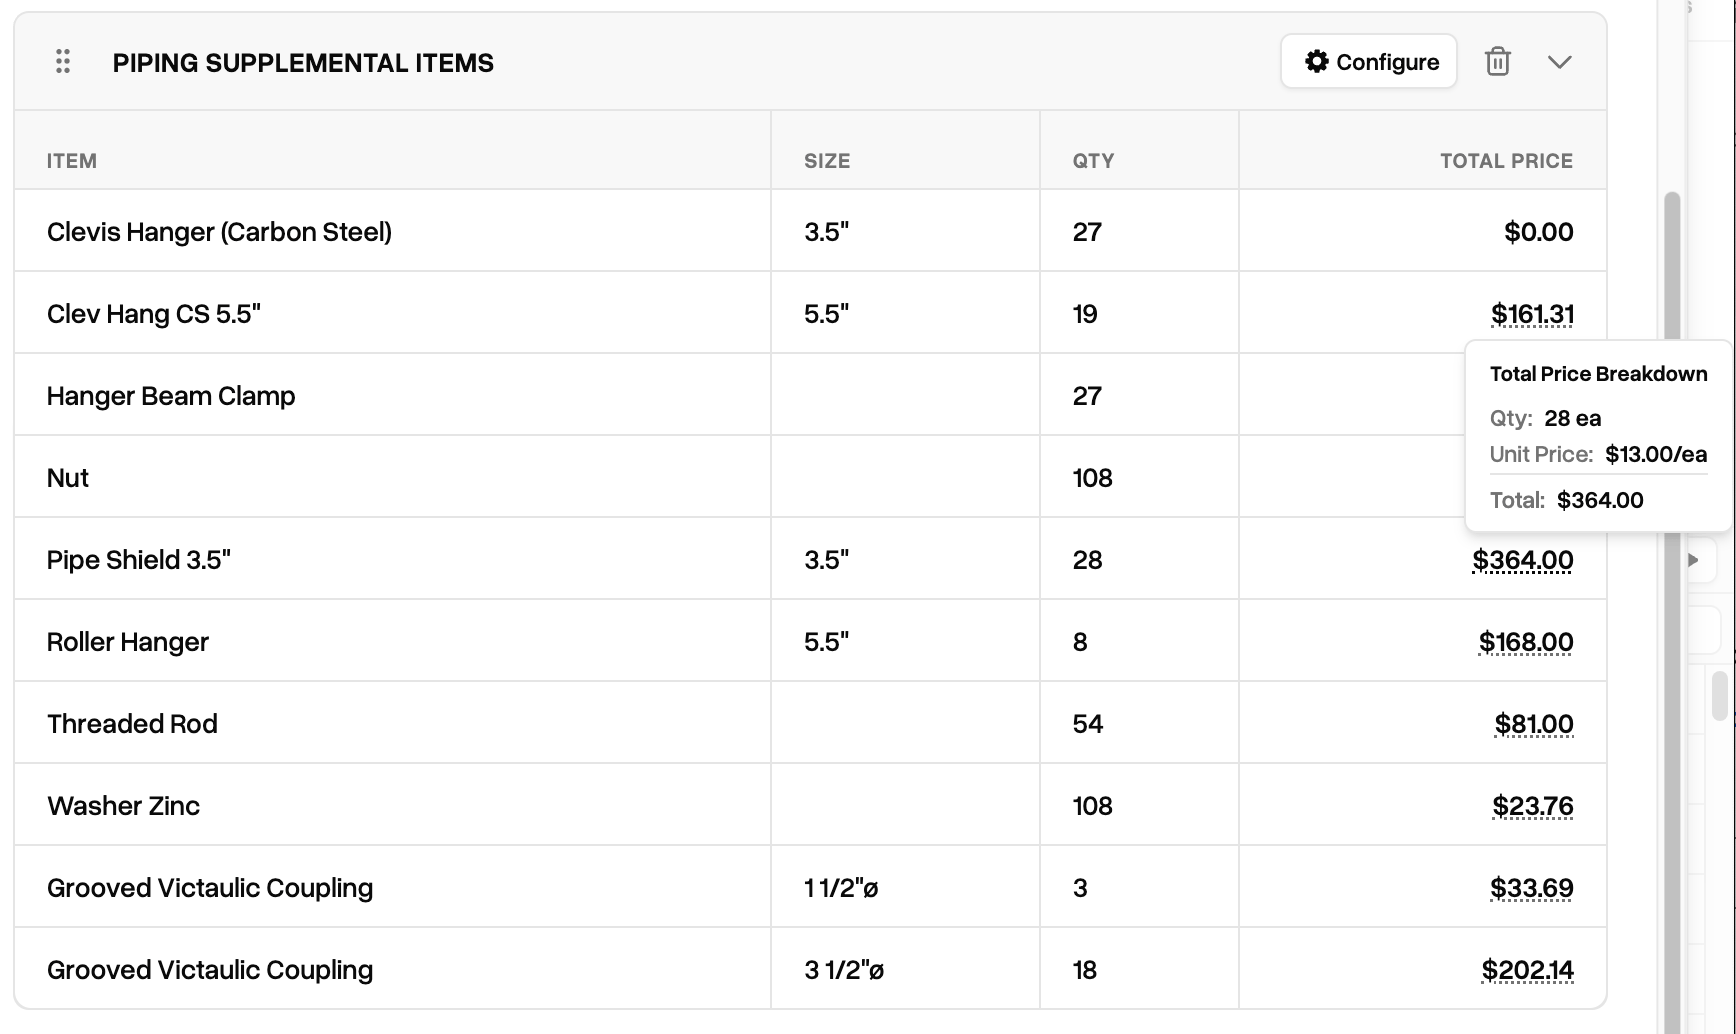
Columns
Columns in data tables are configurable. Grayed-out columns are required, but other columns are removable, and all columns can be rearranged to different orders within the table.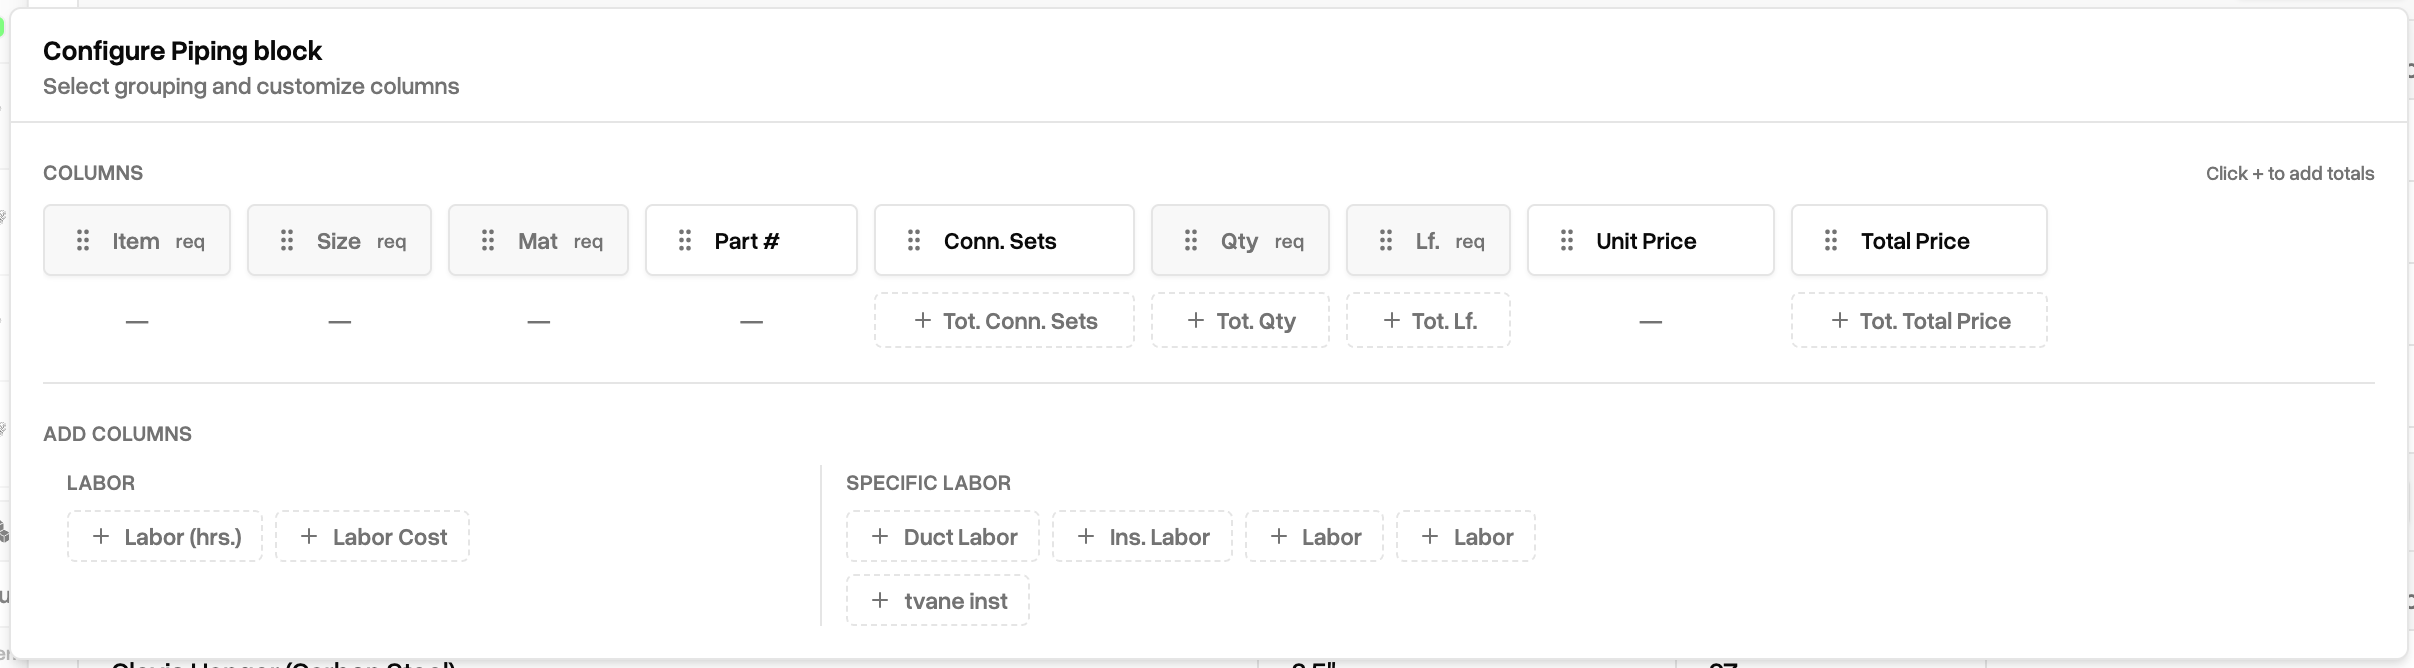
Sorting
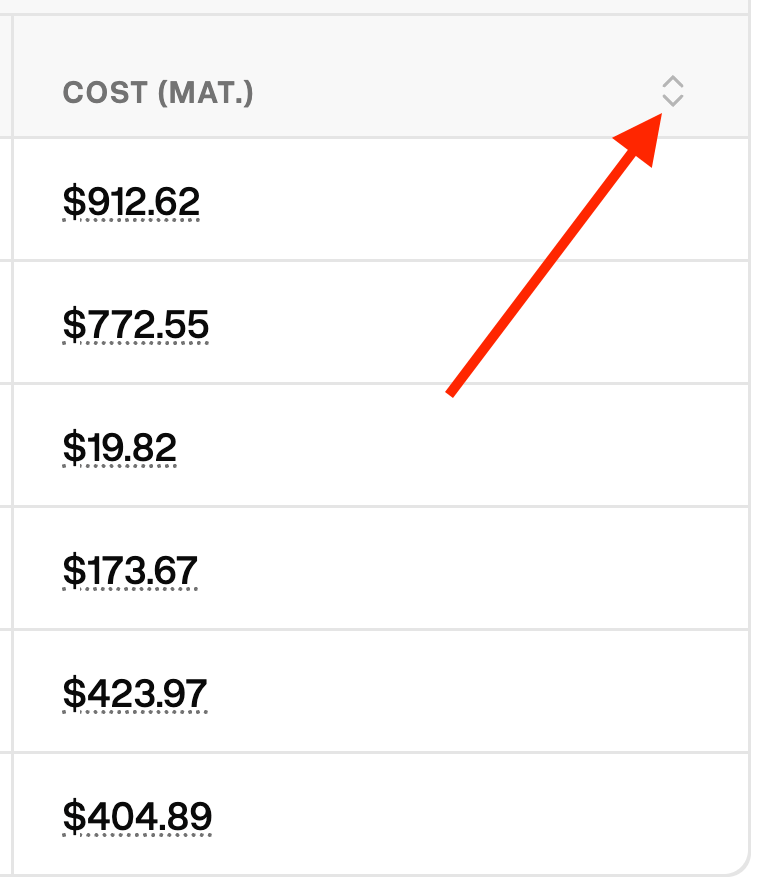
Click the double caret icon in the top right of any column to cycle between ascending, descending, and default sorting for that column.
One column can be sorted at a time, and it will affect every row in a table
Rounding
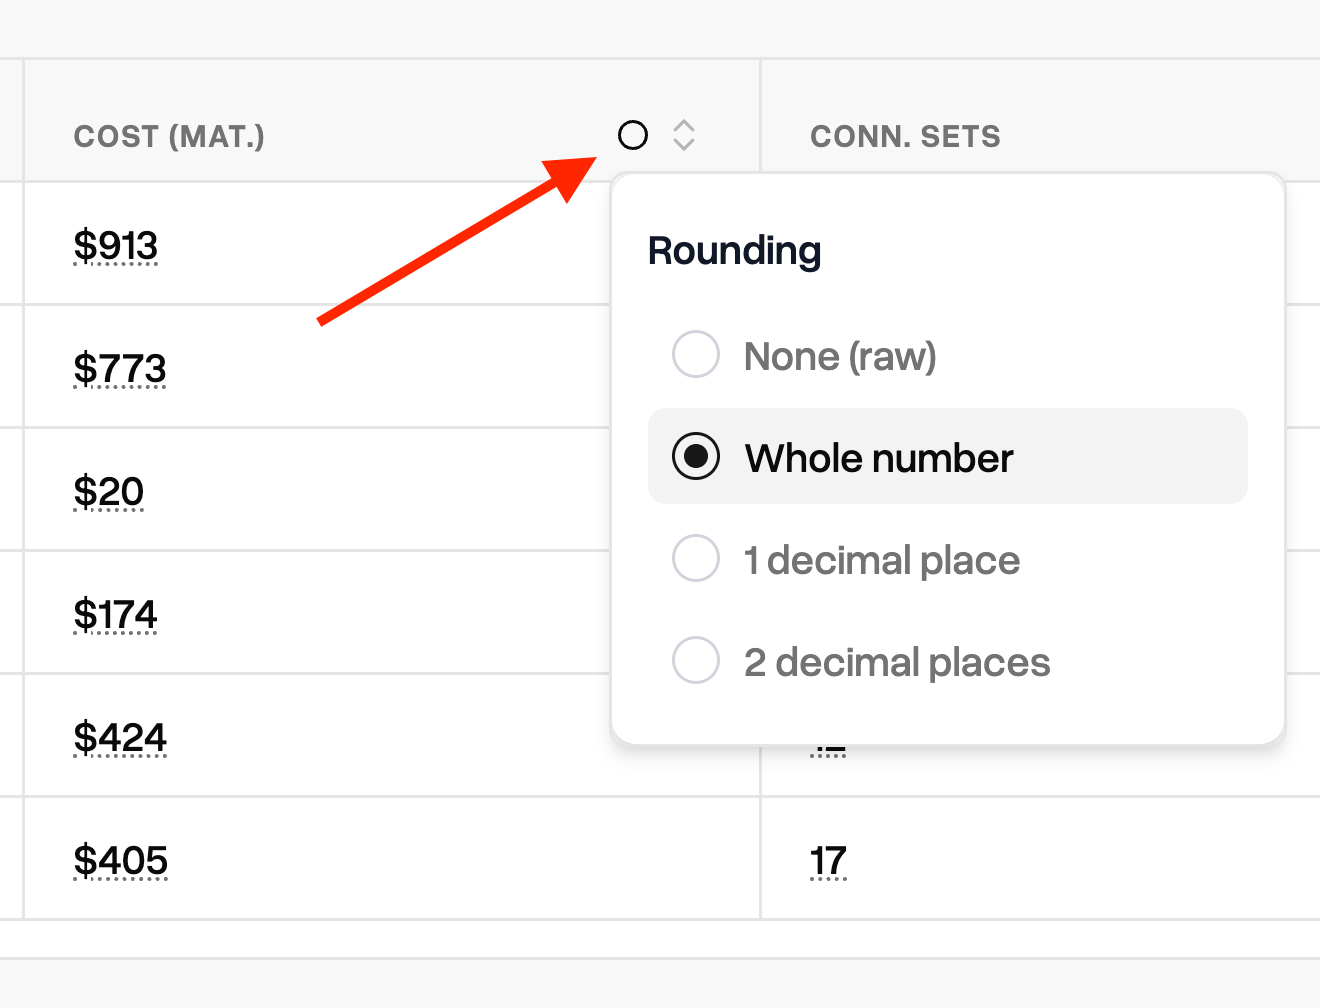
Click the circle icon in the top right of number-based columns to toggle rounding. Choose from None (raw value), whole number, 1 & 2 decimal place rounding.
Selecting a rounding option will apply visually in the report builder as well as in the exported data.
Finalize & Export
When you are ready to generate your report, click theExport button.